Insights & Resources

Rating
Outperform
Unchanged
Expanding the High-Grade Core at Lion. Summer-Fall 2025 drilling successfully extended high-grade mineralization down plunge at the Lion Zone, with impressive intercepts including
8.40 meters grading 8.05% copper equivalent recovered, and 5.10 meters grading 9.86% copper equivalent recovered, reinforcing strong vertical continuity.
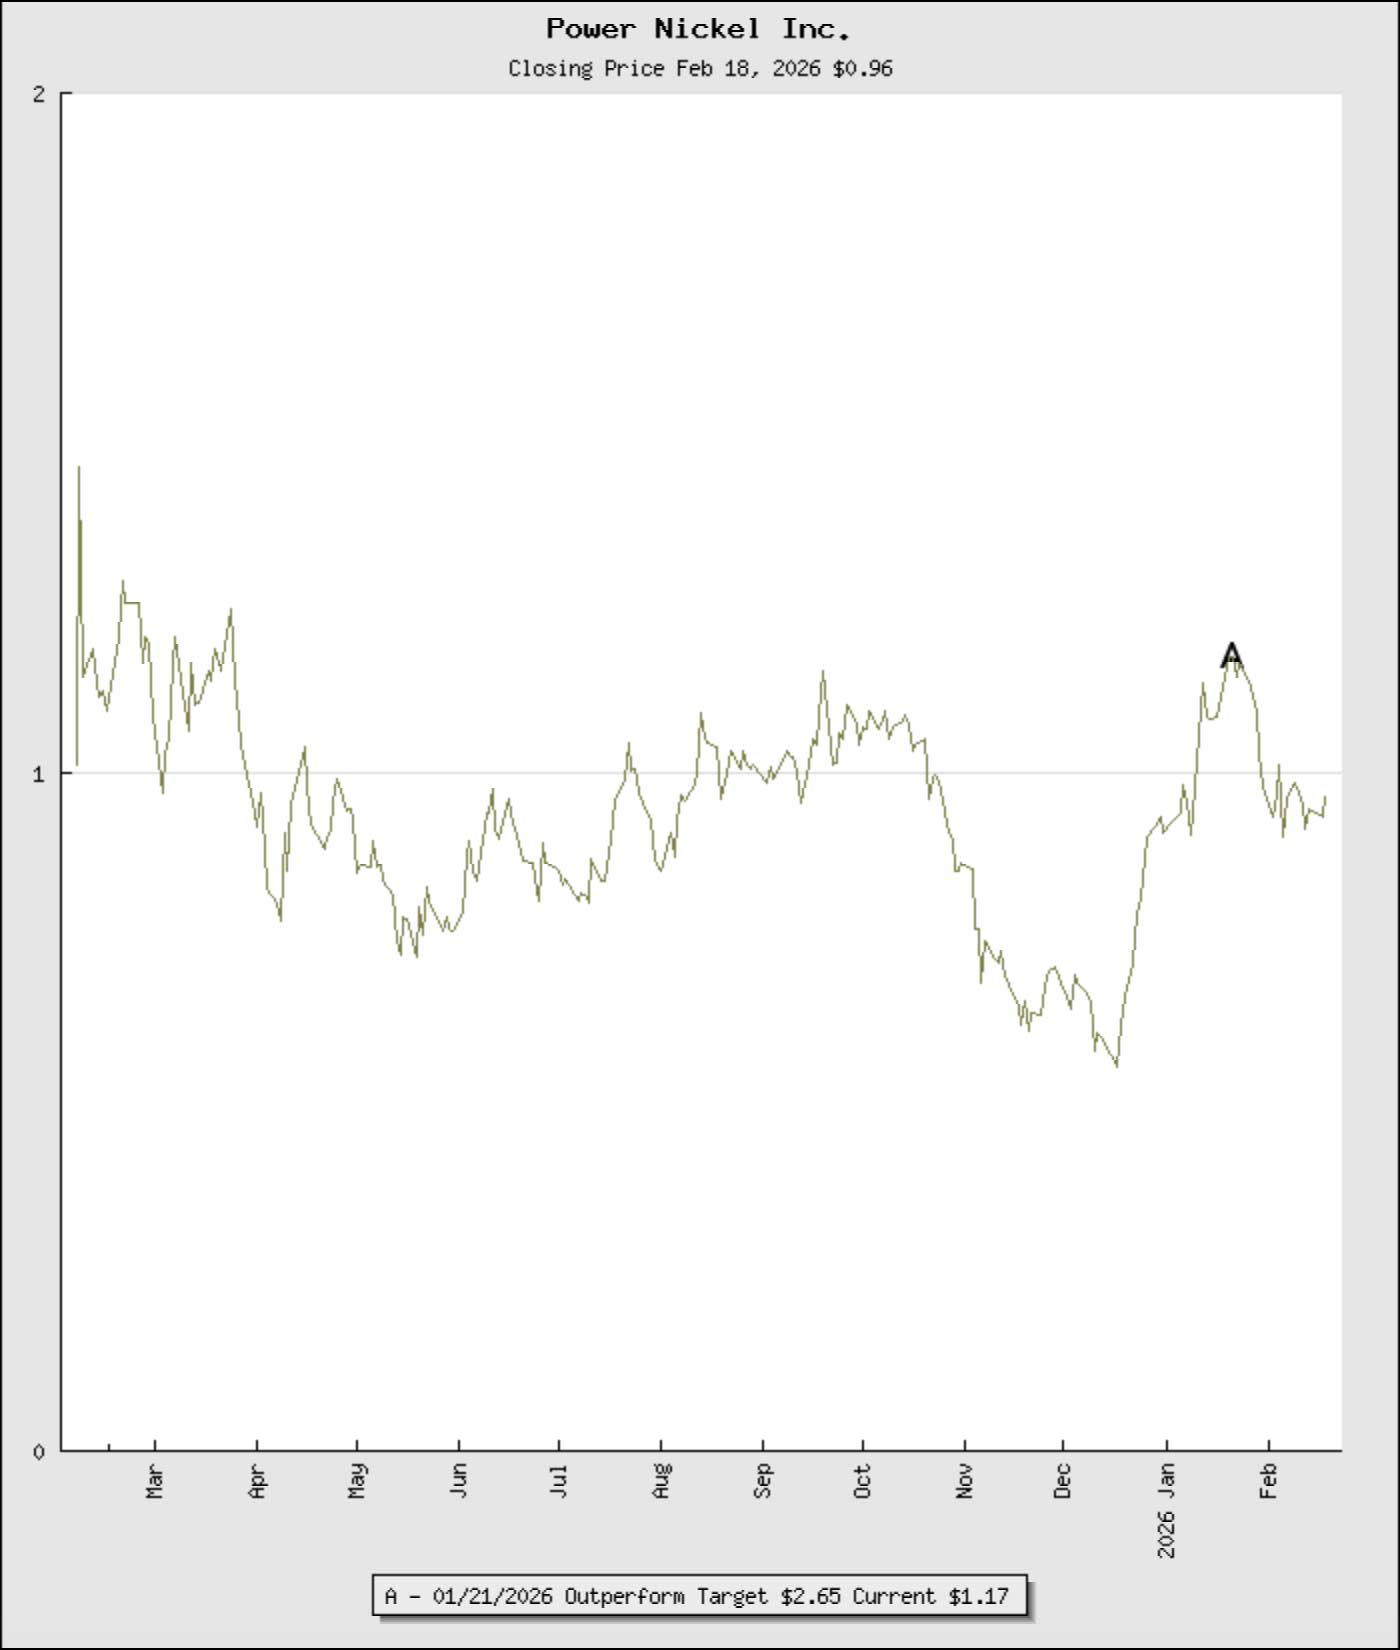
Current Price
$0.96
Target Price
$2.65
Precious Metals Significantly Enhance Value. Assays revealed substantial palladium, platinum, and gold contributions, materially boosting copper-equivalent grades and highlighting the robust polymetallic nature of the deposit.
Market Capitalization
223M
Resource Growth Potential. Step-out drilling west of the main Lion Zone identified additional mineralized lenses, expanding the footprint and demonstrating continued resource growth potential.
Shares Outstanding
232M
Float
218M
Institutional Holdings
68%
12-Month Low/High
$0.37/$1.90
Rating is Outperform. Power Metallic expects to receive the remaining balance of the Fall 2025 drill holes shortly. The company expects to provide a detailed update on the exploration being conducted on Lion West, Tiger Deep, and the Elephant exploration targets, as well as initial exploration on the Li-FT acquisition ground. There will be further updates on the Lion Zone East expansion drilling following the recently recognized high grade east plunging mineralization structures extending from the Lion Main Zone.
Average 90-Day Volume
455220
Fiscal Year End
12/31/2026
Equity Research
Mark Reichman, Managing Director, Equity Research Analyst, Natural Resources (561) 999-2272, mreichman@noblecapitalmarkets.com, Connect on LinkedIn
Hans Baldau, Associate Analyst – hbaldau@noblecapitalmarkets.com
| Revenues ($ MIL) | |||
| Period | 2024 A | 2025 E | 2026E |
| Q1 | 0.0 A | 0.0 A | 0.0 E |
| Q2 | 0.0 A | 0.0 A | 0.0 E |
| Q3 | 0.0 A | 0.0 A | 0.0 E |
| Q4 | 0.0 A | 0.0 E | 0.0 E |
| 0.0 A | 0.0 E | 0.0 E | |
| EPS ($) | |||
| Period | 2024 A | 2025 E | 2026E |
| Q1 | (0.02) A | (0.05) A | (0.07) E |
| Q2 | (0.03) A | (0.03) A | (0.07) E |
| Q3 | (0.03) A | (0.07) A | (0.06) E |
| Q4 | 0(0.04) A | (0.06) E | (0.06) E |
| (0.12) A | (0.22) E | (0.24) E | |
Noble Capital Markets, Inc
Trading: (561) 998-5489 Sales: (561) 998-5491
noblecapitalmarkets.com | Follow Noble on LinkedIn
Power Metallic Mines reported additional strong assay results from its Summer-Fall 2025 drill program at the Lion Zone within the NISK Project, further reinforcing the scale, continuity, and high-grade nature of the deposit. The program was designed to extend mineralization down plunge from known high-grade shoots and to infill key areas of the deposit to support advancement toward an Indicated Mineral Resource classification. The latest results demonstrate meaningful progress on both objectives. Figure 1 summarizes the recently released assay results.
Figure 1:
Lion Zone Assay Results
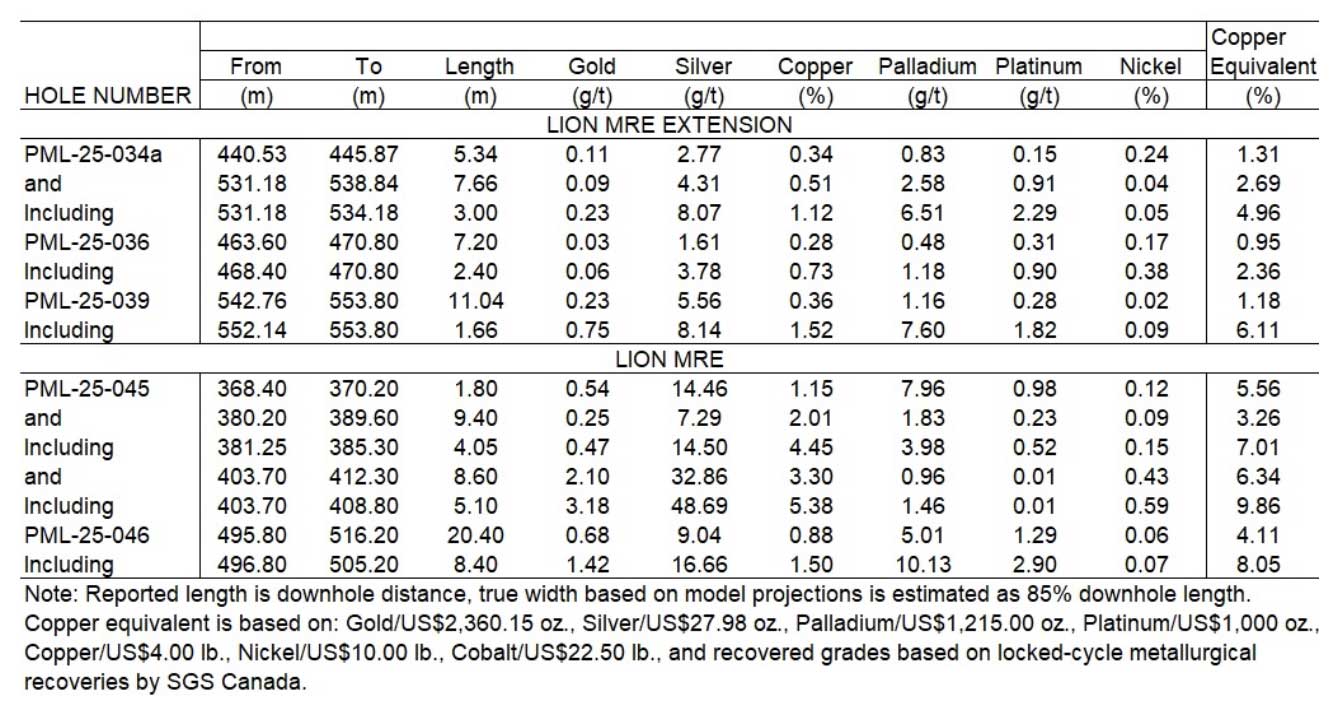
Source: Power Metallic Press Release dated February 18, 2026, and Noble Capital Markets Inc.
Figure 2: Lion Drill Holes with Off-Hole Borehole Electromagnetic (BHEM) Anomalies
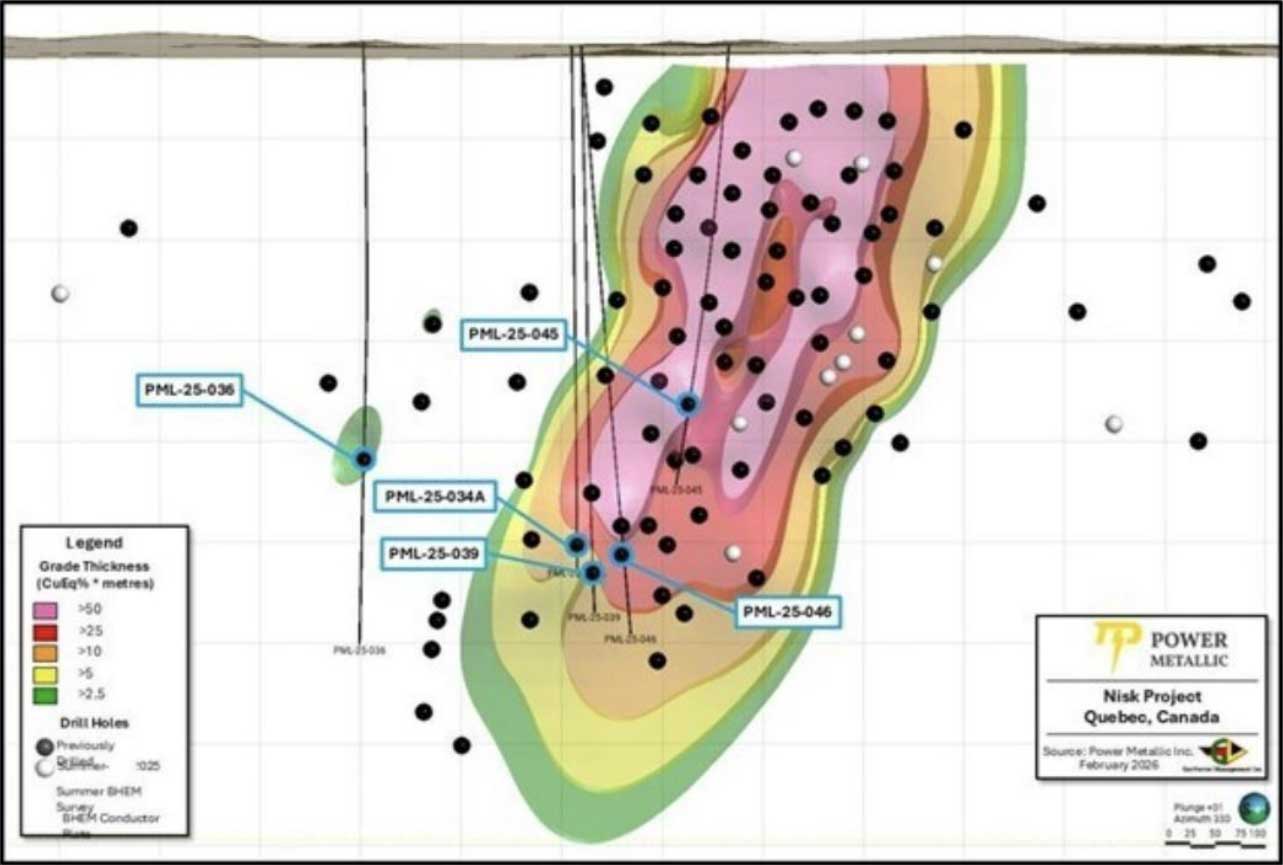
Source: Power Metallic Inc.
Drilling continues to confirm and expand the high-grade core of the Lion Zone. Notably, hole PML-25-046 intersected 20.40 meters grading 4.11% copper equivalent recovered (CuEqRec), including 8.40 meters grading 8.05% CuEqRec. Similarly, hole PML-25-045 returned 8.60 meters grading 6.34% CuEqRec, including 5.10 meters grading 9.86% CuEqRec. These intersections extend mineralization below the central high-grade zone and confirm strong vertical continuity of the higher-grade shoots that will form an important component of future mineral resource modeling.
A particularly significant observation from the program is the strong contribution of precious metals to the overall grade. In hole PML-25-046, initial core logging suggested relatively modest copper mineralization, averaging 0.88% Cu over 20.4 meters. However, assays revealed substantial palladium values averaging 5.01 g/t, along with platinum and gold, materially enhancing the copper-equivalent grade. This underscores the polymetallic, orthomagmatic character of the Lion deposit and highlights the importance of refined geological logging procedures to better identify precious metal-rich zones within the system.
Drilling also continues to demonstrate lateral growth potential. On the west side of the Lion Zone, hole PML-25-034a intersected 7.66 meters grading 2.69% CuEqRec, including a higher-grade interval of 3.00 metres grading 4.96% CuEqRec. In addition, hole PML-25-036, located approximately 150 meters west of the main Lion Zone, returned 7.20 meters grading 0.95% CuEqRec, including 2.40 meters grading 2.36% CuEqRec. This intercept is interpreted as representing a separate polymetallic lens west of the main zone and will be followed up with additional drilling, suggesting further expansion potential beyond the currently defined footprint.
Power Metallic Mines Inc. (OTCQB: PNPPF, TSX.V: PNPN, FRA: IVV1) is a Canadian exploration company focused on advancing the Nisk Project Area (Nisk-Lion-Tiger), a high-grade copper and platinum group element (PGE), nickel, gold, and silver system toward a producing polymetallic mine. Power Metallic has an interest of 80% in the Nisk project, while Critical Elements Lithium Corporation (TSX.V: CRE) owns the remaining interest. Following the June 2025 purchase of 313 adjoining claims representing approximately 167 square kilometers and the staking of 100 square kilometers of land in the Lion Zone, Power Metallic Mines now controls a land package of approximately 313 square kilometers and roughly 50 kilometers of prospective basin margins. Additionally, Power Metallic indirectly has an interest in land packages in British Columbia and Chile through its 50% share ownership in Chilean Metals Inc. which was spun out from Power Metallic via a plan of arrangement in February 2025. Moreover, the company also owns 100% of Power Metallic Arabia which owns a 100% interest in the Jabul Baudan exploration license in The Kingdom of Saudi Arabia’s JabalSaid Belt. The property encompasses over 200 square kilometers in an area recognized for its high prospectivity for copper and zinc mineralization. The region is known for its massive volcanogenic massive sulphide (VMS) deposits. Power Metallic shares trade in the United States on the OTCQB under the symbol “PNPNF, in Canada on the TSX Venture Exchange under the symbol “PNPN”, and on the Frankfurt Exchange under the symbol “IVV1.”
Our fundamental assessment rating, separate from our investment rating and valuation, is based on five core attributes. We assign Power Metallic Mines 3.0 checks out of 5.0, which falls within our “Average” range. In our view, the company benefits from a leadership team with experience in polymetallic systems, a high-grade polymetallic discovery containing nickel, copper, cobalt, and platinum group elements, and a supportive jurisdiction with established mining infrastructure and access to lowcarbon hydropower. The Nisk Main Zone provides a defined mineral resource, while the Lion and Tiger Zone discoveries are the focus of a fully funded, district-scale drill program for resource expansion. The company also maintains a 50% strategic equity stake in Chilean Metals Inc. with exposure to a non-core exploration
Our rating reflects that Power Metallic Mines is in the pre-revenue, resource definition stage. Advancing the Nisk Project toward preliminary economic studies will necessitate subsequent financing rounds. However, the combination of a high-grade polymetallic discovery, access to established infrastructure and low-carbon power in Québec, and a fully funded district-scale drill program supports a continued focus on resource expansion.
Our investment rating is Outperform with a price target of US$2.65 per share or C$3.65 per share. Our valuation is based on a discounted cash flow (DCF) framework reflecting development of the Lion-led polymetallic system at the Nisk Project. We model a single-asset underground operation commencing commercial production in 2030, following continued drilling, resource definition, metallurgical testing, and technical studies. Free cash flows, defined as operating cash flow minus capital expenditures, are modeled from 2026 through 2045, with negative free cash flow during the construction period from 2026 through 2029. Free cash flows are discounted at a 10% rate. Our per share value is rounded to the nearest $0.05.
Key risks include but are not limited to: (1) exploration risk that future drilling may not maintain current high grades or expand resources as projected; (2) commodity price volatility affecting the economic viability of nickel, copper and PGE production; (3) funding risk requiring substantial future capital for development amid potential market uncertainties; (4) execution risk across resource conversion, feasibility studies, and potential mine development stages; (5) permitting risk within Quebec’s regulatory framework despite its mining-friendly jurisdiction; and (6) asset concentration risk with the company’s value heavily dependent on single-project success at Nisk. An investment in Power Metallic Mines should be considered speculative due to the potential for high risk and high reward.
All statements or opinions contained herein that include the words “we”, “us”, or “our” are solely the responsibility of Noble Capital Markets, Inc. (“Noble”) and do not necessarily reflect statements or opinions expressed by any person or party affiliated with the company mentioned in this report. Any opinions expressed herein are subject to change without notice. All information provided herein is based on public and non-public information believed to be accurate and reliable, but is not necessarily complete and cannot be guaranteed. No judgment is hereby expressed or should be implied as to the suitability of any security described herein for any specific investor or any specific investment portfolio. The decision to undertake any investment regarding the security mentioned herein should be made by each reader of this publication based on its own appraisal of the implications and risks of such decision.
This publication is intended for information purposes only and shall not constitute an offer to buy/sell or the solicitation of an offer to buy/sell any security
mentioned in this report, nor shall there be any sale of the security herein in any state or domicile in which said offer, solicitation or sale would be unlawful prior to registration or qualification under the securities laws of any such state or domicile. This publication and all information, comments, statements or opinions contained or expressed herein are applicable only as of the date of this publication and subject to change without prior notice. Past performance is not indicative of future results
Noble accepts no liability for loss arising from the use of the material in this report, except that this exclusion of liability does not apply to the extent that such liability arises under specific statutes or regulations applicable to Noble. This report is not to be relied upon as a substitute for the exercising of independent judgement. Noble may have published, and may in the future publish, other research reports that are inconsistent with, and reach different conclusions from, the information provided in this report. Noble is under no obligation to bring to the attention of any recipient of this report, any past or future reports. Investors should only consider this report as single factor in making an investment decision.
This publication is confidential for the information of the addressee only and may not be reproduced in whole or in part, copies circulated, or discussed to another party, without the written consent of Noble Capital Markets, Inc. (“Noble”). Noble seeks to update its research as appropriate, but may be unable to do so based upon various regulatory constraints. Research reports are not published at regular intervals; publication times and dates are based upon the analyst’s judgement. Noble professionals including traders, salespeople and investment bankers may provide written or oral market commentary, or discuss trading strategies to Noble clients and the Noble proprietary trading desk that reflect opinions that are contrary to the opinions expressed in this research report.
The majority of companies that Noble follows are emerging growth companies. Securities in these companies involve a higher degree of risk and more volatility than the securities of more established companies. The securities discussed in Noble research reports may not be suitable for some investors and as such, investors must take extra care and make their own determination of the appropriateness of an investment based upon risk tolerance, investment objectives and financial status
The following disclosures relate to relationships between Noble and the company (the “Company”) covered by the Noble Research Division and referred to in this research report.
The Company in this report is a participant in the Company Sponsored Research Program (“CSRP”); Noble receives compensation from the Company for such participation. No part of the CSRP compensation was, is, or will be directly or indirectly related to any specific recommendations or views expressed by the analyst in this research report.
Noble intends to seek compensation for investment banking services and non-investment banking services (securities and non-securities related) within the next 3 months.
Noble is not a market maker in the Company.
The fundamental assessment rating system is designed to provide insights on the company’s fundamentals both on a macro level, which incorporates a
company’s market opportunity and competitive position, and on a micro/company specific level. The micro/company specific attributes include operating &
financial leverage, and corporate governance/management. The number of check marks that a company receives is designed to provide a quick reference and
easy determination of the company’s fundamentals based upon the following five attributes of the company (weighting reflects the importance of each attribute
in the overall scoring of company’s fundamental analysis):
| Attribute | Weighting |
|---|---|
| Corporate Governance/Management | 20% |
| Market Opportunity Analysis | 20% |
| Competitive Position | 20% |
| Operating Leverage | 20% |
| Financial Leverage | 20% |
For each attribute, the analysts score the company from a low of zero to a high of ten based upon the analysis described below. The final rating and resulting
check marks is a result of dividing the overall score (out of 100%) by ten.
| Rating | Score | Checks |
|---|---|---|
| Superior | 9.1 to 10 | Five Checks |
| Superior | 8.1 to 9 | Four & A Half Checks |
| Above Average | 7.1 to 8 | Four Checks |
| Above Average | 6.1 to 7 | Three & A Half Checks |
| Average | 5.1 to 6 | Three Checks |
| Average | 4 to 5 | Two & A Half Checks |
| Below Average | 3 to 3.9 | Two Checks |
| Below Average | 2 to 2.9 | One & A Half Checks |
| Low Quality | 0 to 1.9 | One Check |
While these are the attributes currently used for the analyst’s fundamental analysis, the attributes and weighting may be reviewed, updated with additional
attributes, and/or changed in the future based on discussions with the analysts and recommendations from the Director of Research.
Following is the description of each attribute in the fundamental analysis.
We believe that a review of corporate governance and assessment of the senior management are important tools to determine investment merit. Good corporate governance aligns management with the interests of stakeholders. As such, analysts are to rank the company on the basis of good corporate governance principles that may include rules and procedures, board composition and staggered term limits, rights and responsibilities, corporate objectives, monitoring of actions and policies, and accountability. In addition, analysts will assess issues with controlling shareholders and whether decisions have been made in the past that were in the interests of all shareholders. In addition, management will be assessed based on industry experience, expertise, and/or track record.
High ranking example: Board and management that is aligned with the interests of shareholders with incentives based on stock price appreciation and with an experienced management team known for exceptional shareholder returns.
Low ranking example: Concentrated ownership without independent directors that do not necessarily align with all shareholders’ interests.
The Market Opportunity Analysis
In this review, the analyst assesses the company’s macro environment as a measure of understanding the industry. Factors considered include the size and growth potential of the industry under various economic conditions, the emerging demands in the market, technological benefits/disruptions, competition, geographical opportunities, and customer demands/needs, and an assessment of supply and distribution channels. In addition, the analyst will review legal and regulatory trends, as well as potential shifts in consumer or social behavior and natural environment changes.
High rank example: A company in an industry that is growing revenues well above GDP rates (which are on average 2% plus) and/or may have unmet or underserved needs in a rapidly growing market opportunity.
Low rank example: A mature industry that is in secular decline and likely to grow below GDP rates.
The evaluation of the company’s competitive position is another macro environment attribute designed to measure the relevance, market share, position and value proposition, and sustainable differentiations of the company and its products/services within its industry. Ease of entry into the industry and the ability of other well-funded players to potentially enter the market would be determined. As such, the assessment would consider the company’s strengths and advantages of its products/services against weaknesses and limitations. This may include the company’s current brand awareness, pricing and cost structure, current market strategies and geographic penetration that may affect demand for its products/services. In addition, the company’s competitors would be evaluated.
High rank example: An analyst would consider the company’s product to be superior to its competitors and that should allow the company to gain market share.
Low rank example: A company with a “me-too” product that does not have any significant technology advantages in an industry that has low barriers to entry.
Simplistically, operating leverage is determined by the operating income relative to changes in revenue. The analyst will calculate the impact on sensitivity on gross margins and variable costs to determine operating leverage. The analyst will take into account the ability of the company to cut fixed and variable costs in a challenged revenue environment and technological changes that may impact operating expenses. In addition, the analyst is to assess corporate strategies that include capital investment, which may be required for sustainable revenue growth, marketing expenses, and the company’s ability to attract and retain talent and/or employees. The analyst should focus on the revenue opportunity and determine the price elasticity of demand for the company’s products or services. In other words, the analyst is to rank the company based on improved operating margins going forward on an absolute and relative basis.
High rank example: A company that has improving margins for the foreseeable future, with significant price elasticity.
Low rank example: A company that is in a challenged revenue environment with a fixed cost structure and limited ability to cut costs, indicating an outlook for declining margins.
A strict definition of financial leverage is total debt divided by total shareholder’s equity. Financial leverage analysis is to determine the company’s ability to improve shareholder value by means of utilizing its balance sheet to grow organically or to acquire assets. Analysts may look at the company’s debt to cash flow leverage ratio, interest coverage ratios, or debt to equity ratios. In addition, the interest rate environment and the outlook for interest rates are a factor in determining the company’s ability to manage financial leverage. Finally, the analyst is expected to determine the ability to service the debt given the industry and/or company profile, such as cyclicality, barriers to entry, history of bankruptcy, consistency in revenue and profit growth, or predictability in sales and profits and large cash reserves. The analyst is expected to take into account capital intensity of the company and the anticipated of capital allocation decisions
High rank example: A company with predictable and growing revenue and cash flow with modest debt levels. This may indicate that the company could improve shareholder value through growth investments, including acquisitions, using debt financing.
Low rank example: A company in a cyclical industry in a late stage economic cycle that has above average debt leverage and is in an industry that has a history of financial challenges, including bankruptcies.
Senior Equity Analyst focusing on Basic Materials & Mining. 20 years of experience in equity research. BA in Business Administration from Westminster College. MBA with a Finance concentration from the University of Missouri. MA in International Affairs from Washington University in St. Louis. Named WSJ ‘Best on the Street’ Analyst and Forbes/StarMine’s “Best Brokerage Analyst.” FINRA licenses 7, 24, 63, 87
Unless otherwise noted through the dropping of coverage or change in analyst, the analyst who wrote this research report will provide continuing coverage on this company through the publishing of research available through Noble Capital Market’s distribution lists, website, third party distribution partners, and through Noble’s affiliated website, channelchek.com.
This report is intended to provide general securities advice, and does not purport to make any recommendation that any securities transaction is appropriate for any recipient particular investment objectives, financial situation or particular needs. Prior to making any investment decision, recipients should assess, or seek advice from their advisors, on whether any relevant part of this report is appropriate to their individual circumstances. If a recipient was referred to by an investment advisor, that advisor may receive a benefit in respect of transactions effected on the recipients behalf, details of which will be available on request in regard to a transaction that involves a personalized securities recommendation. Additional risks associated with the security mentioned in this report that might impede achievement of the target can be found in its initial report issued by . This report may not be reproduced, distributed or published for any purpose unless authorized by.
All views expressed in this report accurately reflect my personal views about the subject securities or issuers.
No part of my compensation was, is, or will be directly or indirectly related to any specific recommendations or views expressed in the public appearance and/or research report.
Neither I nor anybody in my household has a financial interest in the securities of the subject company or any other company mentioned in this report.
| NOBLE RATINGS DEFINITIONS | % OF SECURITIES COVERED | % IB CLIENTS |
|---|---|---|
| Outperform: potential return is >15% above the current price | 84% | 15% |
| Market Perform: potential return is -15% to 15% of the current price | 16% | 5% |
| Underperform: potential return is >15% below the current price | 0% | 0% |
NOTE: On August 20, 2018, Noble Capital Markets, Inc. changed the terminology of its ratings (as shown above) from “Buy” to “Outperform”, from “Hold” to “Market Perform” and from “Sell” to “Underperform.” The percentage relationships, as compared to current price (definitions), have remained the same.
Additional information is available upon request. Any recipient of this report that wishes further information regarding the subject company or the disclosure information mentioned herein, should contact Noble Capital Markets, Inc. by mail or phone.
Noble Capital Markets, Inc.
150 E Palmetto Park Rd, Suite 110
Boca Raton, FL 33432
561-994-1191
Noble Capital Markets, Inc. is a FINRA (Financial Industry Regulatory Authority) registered broker/dealer.
Noble Capital Markets, Inc. is an MSRB (Municipal Securities Rulemaking Board) registered broker/dealer.
Member – SIPC (Securities Investor Protection Corporation)
Report ID: 28060